
If you have at least one person who can spend a few hours on setup, start with a lightweight SaaS monitoring tool today. If your team is stretched thin or you’ve already had an outage that cost you real money, skip the DIY path and contact a managed IT provider like Rivell instead.
Fastest next steps, depending on your path:
- DIY start (same day): Inventory every device on your network, enable SNMP on routers and switches, and set one uptime alert for your internet connection. You’ll have basic visibility within hours.
- Managed provider (this week): Request an assessment, share your device list, and let onboarding handle the rest. Expect full baseline monitoring within two to four weeks.
- Either path: Document what you monitor and schedule a 7-day review to tighten thresholds once you see real traffic patterns.
The DIY path costs less upfront. The managed path costs less over time when you factor in staff hours, missed alerts, and the learning curve.
Key Takeaways
Most small businesses get the best return from managed network monitoring when they lack dedicated IT staff, and the fastest DIY wins come from SNMP-based device checks, dependency-aware alerts, and a baselining period before thresholds are locked in.
| Point | Details |
|---|---|
| Start with core metrics | Prioritize uptime, WAN utilization, device health, and SaaS synthetic checks before adding complexity. |
| Tune thresholds after baselining | Wait 3–5 days of real traffic data before locking in warning and critical thresholds to avoid alert fatigue. |
| DIY has hidden costs | Staff time, missed alerts, and slower incident detection often make DIY more expensive than a managed contract over 24 months. |
| Hire managed when outages cost more | If a single outage costs more than a monthly service fee, managed monitoring pays for itself on the first incident prevented. |
| Rivell for NJ small businesses | Rivell provides 24/7 monitoring and onboarding under 30 days for businesses across New Jersey, including regulated industries. |
Table of Contents
- What does small business network monitoring actually watch?
- Priority features your monitoring solution needs
- SaaS vs. on-prem vs. hybrid: where should you start?
- How to choose a monitoring solution or provider
- A one-day setup checklist to get monitoring running fast
- When should you hire a managed IT provider?
- AIOps and observability: what small businesses can use now
- The case for managed monitoring is stronger than most small teams realize
- Rivell provides 24/7 monitoring for New Jersey small businesses
- Sources
What does small business network monitoring actually watch?
Small business network monitoring tracks four core signal types: availability (is the device reachable?), device health (CPU, memory, temperature), traffic and bandwidth (who is using what), and synthetic checks (can your team actually reach Microsoft 365 or your payment processor?). ManageEngine’s SMB monitoring guidance recommends prioritizing exactly these metrics rather than chasing enterprise-scale telemetry that a small team can’t act on.
Each signal maps to a real business problem:
- Availability / ping / uptime: A downed router means your POS system stops processing payments.
- Latency and packet loss: Even 5% packet loss on a VoIP call makes it unintelligible.
- WAN utilization: A saturated internet link slows every cloud app your team uses.
- CPU / memory / temperature: An overheating switch will fail before you see it coming.
- Interface errors: Incrementing CRC errors on a port usually mean a bad cable or failing NIC.
- Wi-Fi client load: Too many clients on one access point degrades everyone’s experience.
- DNS resolution checks: If your DNS resolver is slow, every browser request feels broken.
- Synthetic SaaS checks: Confirms your team can reach critical apps, not just that your router is up.
Think of it as a simple chain: each device sends data to a monitoring system, which compares readings against thresholds and fires an alert or triggers an automated action when something crosses a line. The practical monitoring stack for most small businesses starts with SNMP-based device checks, adds flow monitoring for WAN bandwidth context, and reserves packet capture for targeted troubleshooting only.
Pro Tip: Add a synthetic check for your top two or three SaaS apps (Microsoft 365, your payment gateway, your VoIP provider). A green router with a broken DNS path still means your team can’t work. Pair this with uptime best practices to cover your web presence too.
Priority features your monitoring solution needs
The three non-negotiable categories are visibility, alerting, and ease of use. Everything else is secondary until those three work reliably.
Visibility features:
- Auto-discovery and topology mapping (finds devices automatically, shows dependencies)
- SNMP, WMI, and SSH support for routers, switches, servers, and workstations
- NetFlow or sFlow for bandwidth and “top talker” visibility
- Synthetic checks for cloud and SaaS reachability
- Basic log collection or a lightweight SIEM feed for security events
Alerting features:
- Dependency-aware alerts that suppress downstream noise when an upstream device fails
- Multi-level thresholds (warning and critical, not just one binary trigger)
- Mobile push and email notifications, with escalation to a secondary contact
- Sustained-deviation alerts (trigger after a condition persists for N minutes, not on a single spike)
Ease-of-use features:
- A dashboard that shows network health at a glance without requiring a training course
- SLA and availability reports you can export for management or compliance review
- Integration with your ticketing system or a basic webhook to Slack or Teams
Dependency-aware alerting is the single feature most small teams skip and then regret. When a core switch goes down, every device behind it also goes offline. Without dependency awareness, you get 40 simultaneous alerts instead of one. That’s not a monitoring system helping you; that’s a monitoring system burying you.
Pro Tip: Wait at least three to five days after initial deployment before tightening thresholds. Baseline-based thresholds built from real traffic patterns produce far fewer false positives than defaults copied from a vendor’s documentation.
SaaS vs. on-prem vs. hybrid: where should you start?
Start with SaaS unless you have a specific reason not to. It’s faster to deploy, requires no server to maintain, and scales as you add devices. On-premises makes sense when data residency rules or air-gapped environments make cloud delivery impractical. Hybrid works for businesses mid-transition, running some workloads on-prem and others in the cloud.
| Factor | SaaS | On-Premises | Hybrid |
|---|---|---|---|
| Setup time | Hours to days | Days to weeks | Weeks |
| Maintenance burden | Provider handles it | Your team owns it | Split responsibility |
| Cost shape | Monthly subscription per device or host | Upfront license + hardware | Mixed CapEx and OpEx |
| Remote/cloud visibility | Strong by default | Requires remote pollers | Depends on configuration |
| Data residency control | Limited | Full | Partial |
Typical cost shapes to budget for:
- SaaS tools commonly price per monitored device or per host, with free tiers or 30-day trials available for evaluation.
- On-premises licenses often carry a one-time fee plus annual maintenance, plus the cost of the server running the software.
- Managed monitoring (bundled into an MSP contract) typically runs as a flat monthly fee per site or per device block.
One point that’s easy to overlook: your deployment model affects your compliance posture. If you’re in healthcare or financial services, a SaaS tool that stores device telemetry on shared infrastructure may create data-handling obligations under HIPAA or state privacy laws. Confirm where your monitoring data lives before you sign up.
How to choose a monitoring solution or provider
Rank candidates by four criteria in this order: ease of deployment for your team’s skill level, coverage of the metrics that matter to your specific environment, alert quality (dependency-aware, tunable thresholds), and total cost of ownership over 24 months. DIY approaches often look cheaper at month one but accumulate hidden costs in staff time, tool integrations, and slower incident detection.
Questions to ask any vendor or provider:
- What is your guaranteed response time for a critical alert, and what does your SLA cover?
- How long does onboarding take, and what do you need from us to start?
- How is licensing structured — per device, per site, or per host?
- Do you support remote pollers for branch offices or cloud workloads?
- What integrations exist for our ticketing system or communication tools?
- Can we start with a trial or pilot before committing to a contract?
- Do you have references or case studies from businesses in our industry?
Red flags to walk away from:
- No free trial or pilot option before a long-term contract
- Pricing that requires a sales call to get a ballpark number
- No dependency-aware alerting (you will drown in noise)
- Agent-only deployment where installing agents on every device is impractical
- No synthetic or SaaS checks (misses the most common small-business failure point)
- Vague onboarding timelines with no defined milestones
Selection framework:
- Fit to staff: Does your team have 5 hours a week to manage this, or 30 minutes?
- Fit to budget: Is a monthly OpEx subscription easier to justify than a CapEx license?
- Fit to risk: Do you operate in a regulated industry where compliance reporting is required?
A 30-day pilot with focused metrics and defined escalation rules gives you real evidence to make this decision rather than relying on a vendor demo.
A one-day setup checklist to get monitoring running fast
Work through this in order. Steps 1 through 4 can realistically be done in a single afternoon.
- Inventory your devices. List every router, switch, firewall, server, NAS, and access point. Include the IP address, device type, and owner. A spreadsheet works fine.
- Enable SNMP on network devices. Use SNMPv3 with authentication and encryption. Set a non-default community string if you’re still on SNMPv2c.
- Run auto-discovery. Point your monitoring tool at your IP ranges and let it find devices. Verify the discovered list against your inventory.
- Configure reachability and synthetic checks. Set up ping/ICMP checks for all devices and HTTP/HTTPS synthetic checks for your top SaaS apps.
- Set initial thresholds. Use the values below as a starting point, then tighten after 5 days of baseline data.
- Configure alert channels. Route critical alerts to email and mobile push. Add a secondary contact for after-hours escalation.
- Simulate a test incident. Unplug a non-critical device and confirm the alert fires within your expected window.
- Document a basic runbook. One page: what the alert means, first three steps to take, and who to call if those steps don’t resolve it.
- Schedule a 7-day review. Revisit thresholds, suppress any noisy alerts, and confirm coverage is complete.
Sample starting thresholds (adjust after baselining):
| Metric | Warning | Critical |
|---|---|---|
| Ping / uptime | 1 missed poll | 3 consecutive missed polls |
| Latency to primary SaaS | high latency | very high latency |
| WAN utilization | high utilization for several minutes | >90% for 5 min |
| AP client count | >30 clients | a large number of clients |
| Server CPU | high utilization for an extended period | >90% for 10 min |
| Switch CPU temperature | high temperature | very high temperature |
When should you hire a managed IT provider?
Hire a managed provider when the cost of an outage exceeds the monthly service fee, or when no one on your team has consistent time to watch alerts and respond. Those two conditions cover most small businesses.
Specific signals that it’s time:
- You’ve had the same recurring issue more than twice and it’s still not resolved
- Alert noise is so high that your team has started ignoring notifications
- A staff departure would leave no one who understands the network
- You operate in healthcare, legal, or finance and need documented compliance coverage
- Your mean time to resolve an incident is measured in hours, not minutes
Managed services shift the monitoring workload to a provider team with specialist staff, prebuilt escalation processes, and continuous coverage. The result is typically faster detection and resolution than a small in-house team can sustain.
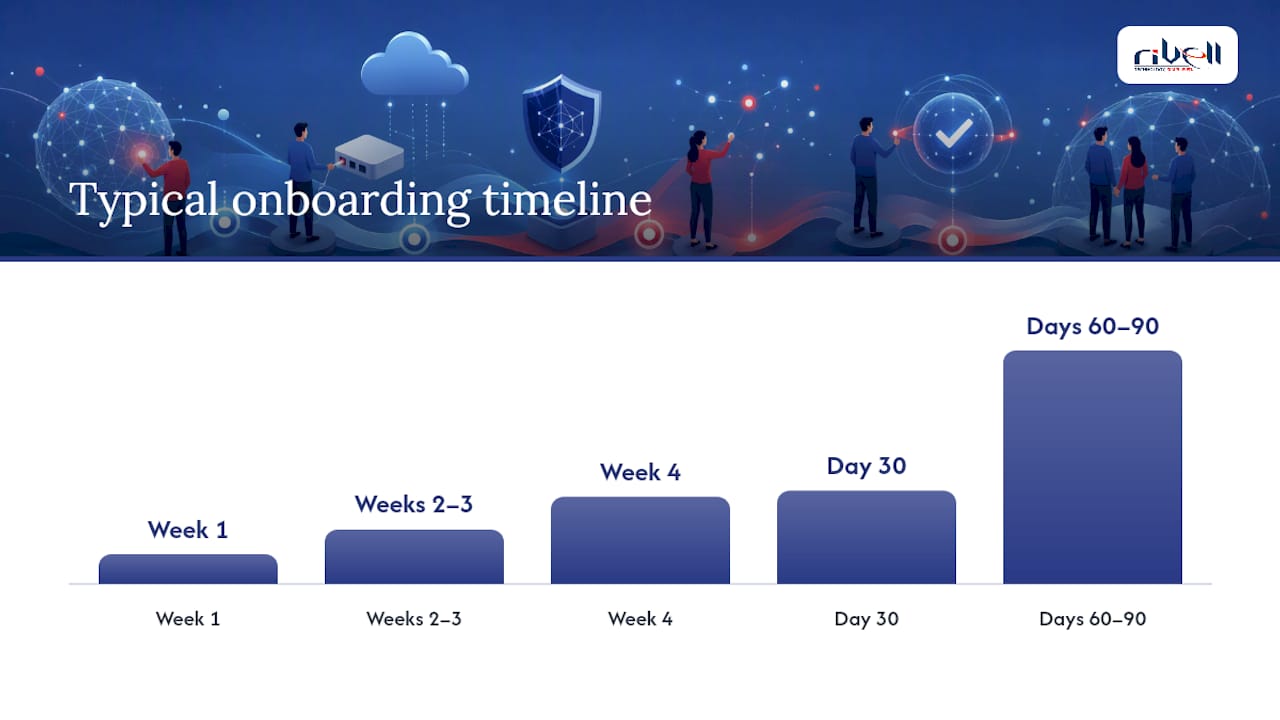
Typical onboarding timeline with a managed provider:
- Week 1: Discovery call, device inventory review, and access provisioning.
- Weeks 2–3: Monitoring agents and collectors deployed, initial dashboards configured.
- Week 4: Baseline established, alert thresholds tuned, escalation paths confirmed.
- Day 30: First review meeting, remediation priorities identified.
- Days 60–90: Proactive recommendations delivered, reporting cadence established.
What you should expect from a provider after onboarding: a defined SLA with response-time commitments for critical alerts, regular reporting (weekly or monthly), proactive alerts before issues become outages, and a clear escalation path when something needs hands-on attention. Centralizing monitoring for both cloud and on-prem environments under one provider also cuts the coordination overhead that slows incident response when tools are fragmented.
AIOps and observability: what small businesses can use now
SMBs don’t need a full observability platform to benefit from automation. The practical starting point is using AIOps selectively: automate noise reduction first, then add predictive alerting as your data matures.
BizTech reports that SMBs are adopting AIOps to handle expanding observability demands, and that combining automation with operational runbooks produces measurable reductions in problem-detection time. Generative AI assistants in newer monitoring platforms can also let non-technical staff ask plain-language questions about network status, which lowers the skill barrier for small teams.
Practical steps you can take now:
- Centralize logs from network devices, servers, and endpoints into a single platform. Fragmented data is the main reason incidents take longer to diagnose.
- Add one AIOps rule targeting your highest-severity alert type. Noise reduction on a single alert category is enough to demonstrate ROI before expanding.
- Build runbooks for your three most frequent incidents. Attach them to the relevant alerts so whoever responds has a starting point.
- Plan for data consolidation as you grow. A monitoring platform that can ingest both on-prem and cloud telemetry avoids a painful migration later.
Cloud security practices are worth reviewing alongside observability improvements, since visibility gaps and security gaps tend to appear in the same places.
The case for managed monitoring is stronger than most small teams realize
The conventional wisdom says DIY monitoring is fine for small businesses because the tools are cheap and the setup is straightforward. That’s true for the first afternoon. It stops being true around week three, when alert fatigue sets in, thresholds haven’t been tuned, and the one person who set everything up is on vacation.
The real cost of DIY isn’t the software license. It’s the 4 AM alert that nobody saw, the hour spent figuring out which of 60 simultaneous notifications actually matters, and the post-mortem where you realize the problem started 48 hours before anyone noticed. Those costs don’t show up on a budget line, but they show up in lost productivity, customer impact, and staff burnout.
Managed monitoring doesn’t mean giving up control. It means having a team that watches your network the way you watch your revenue: continuously, with context, and with a plan for what to do when something goes wrong. For most small businesses, that’s a better use of money than a monitoring tool that runs unattended.
Rivell’s years of experience serving New Jersey businesses across healthcare, legal, and professional services means the monitoring approach is calibrated to the compliance and operational realities those industries face, not just generic best practices.
Rivell provides 24/7 monitoring for New Jersey small businesses
A managed network-monitoring engagement should define the covered devices and systems, alert thresholds, escalation ownership, maintenance windows, and reporting cadence before monitoring begins. New Jersey small businesses can compare that managed scope with the DIY steps described above.
Onboarding starts with a no-obligation assessment: Rivell reviews your current environment, identifies coverage gaps, and proposes a monitoring and management plan with a defined SLA. From there, deployment typically runs two to three weeks, followed by a 30-day baseline period where thresholds are tuned to your actual traffic.
A managed network-monitoring scope should document which network devices and servers are monitored, which alerts are actionable, who handles escalation, and how maintenance and patching responsibilities are divided. Rivell’s server and network support page outlines the related operational scope for New Jersey businesses.
To get started, request an assessment at Rivell or call Rivell directly to discuss your environment and SLA options.
Sources
The following sources were used for claims and recommendations throughout this article:
- 3 Ways SMBs Can Enhance Network Observability and Prevent Downtime | BizTech Magazine
- Network Performance Monitoring for Small Business – ManageEngine OpManager
For trials and demos, check vendor documentation directly or ask any prospective provider for a 30-day pilot before committing to a contract.