
RTO is how long your systems can be down after a failure. RPO is how much data you can afford to lose. Both are measured differently: RTO runs forward from the moment of failure, RPO runs backward to the last clean recovery point. Together, as TechTarget explains, they define your recovery requirements and your cost envelope. Before you assign a single number to any system, run a Business Impact Analysis (BIA) and tier your applications by criticality. Everything else follows from that.
RTO and RPO become operational only when they are connected to service dependencies, monitoring, escalation, restoration, and business validation. Rivell’s IT downtime prevention and recovery guide maps those controls into one incident lifecycle.
Key Takeaways
RTO and RPO are independent parameters set by business risk, not IT preference, and both require a BIA, application tiering, and regular testing to be meaningful.
| Point | Details |
|---|---|
| RTO vs. RPO distinction | RTO measures maximum acceptable downtime (forward from failure); RPO measures maximum acceptable data loss (backward from failure). |
| BIA comes first | Set numeric targets only after a Business Impact Analysis converts hourly business loss into time thresholds. |
| Tier applications | Group systems by recovery tolerance; applying one-size-fits-all targets drives budget bloat and project failure. |
| Test your targets | Documented objectives are hypotheses until validated by full restore and failover exercises; track actual MTTR against RTO. |
| Rivell’s role | Rivell provides BIA-driven target-setting, configured backups and replication, tested runbooks, and an ongoing review cadence for New Jersey businesses. |
Table of Contents
- What is RTO, and why does it drive your recovery architecture?
- What is RPO, and how does it shape your backup strategy?
- How RTO and RPO differ, and where teams get confused
- How to calculate and set RTO and RPO: a practical framework
- Mapping RTO and RPO to application tiers
- Technical approaches to meet your RTO and RPO targets
- Cost and operational trade-offs when you tighten targets
- How Rivell assesses and implements RTO and RPO targets
- What IT leaders get wrong when negotiating RTO and RPO with executives
- Rivell helps New Jersey businesses turn RTO and RPO targets into tested reality
- Sources
What is RTO, and why does it drive your recovery architecture?
Recovery Time Objective (RTO) is the maximum time a system can remain offline before the business suffers unacceptable harm. The clock starts the moment the outage begins, not when someone notices it or opens a ticket.
Think of it this way: a payment gateway that processes $50,000 per hour has a very different RTO than an internal knowledge base that employees consult once a week. The payment gateway might carry an RTO of 15 minutes. The wiki can tolerate 24 hours or more.
Typical RTO ranges by criticality:
- Mission-critical (Tier 0/1): 0–60 minutes. Payment processing, EHR systems, core banking, real-time trading platforms.
- Business-critical (Tier 2): 2–8 hours. CRM, ERP, email, VoIP.
- Important but not urgent (Tier 3): 8–24 hours. Reporting tools, internal portals, dev/test environments.
- Non-critical (Tier 4): 24–72 hours or more. Archives, static documentation sites.
One thing worth separating is this: RTO is a target, not a measurement. Mean Time to Recover (MTTR) is what you actually achieve during an incident. If your RTO is 1 hour but your MTTR consistently runs 3 hours, you have a gap to close, and the only way to find it is through regular testing.
What is RPO, and how does it shape your backup strategy?
Recovery Point Objective (RPO) is the maximum age of data you can restore to without causing unacceptable business loss. Measured backward from the moment of failure, it answers one question: how much data can you afford to recreate or simply lose?
A hospital system that records patient vitals every minute cannot tolerate an RPO of 4 hours. A financial trading platform may need an RPO measured in seconds. A static marketing archive might accept an RPO of 24 hours without anyone noticing.
As Veeam notes, RPO directly drives backup frequency. If your RPO is 1 hour, you need backups or replication running at least every 60 minutes. If it’s 15 minutes, you’re looking at continuous data protection (CDP) or synchronous replication. The tighter the RPO, the more infrastructure you need to support it.
Where RPO tends to dominate the conversation:
- Financial transaction systems: Every transaction that falls outside the recovery window is a reconciliation problem, potentially a regulatory one.
- Patient records (EHR/EMR): Missing clinical data creates patient safety and HIPAA liability exposure.
- E-commerce order management: Lost orders between the last backup and the failure point mean real revenue disputes.
Where RPO matters less: static content repositories, read-only reference databases, or any system where data can be reconstructed from another authoritative source.
Pro Tip: If your backup frequency doesn’t match your RPO, your RPO is a fiction. Audit your actual backup schedules against documented objectives at least quarterly.
How RTO and RPO differ, and where teams get confused
The confusion is understandable. Both are time-based recovery metrics, both live in the same DR plan, and both get discussed in the same BIA meeting. But they measure completely different things.
| Dimension | RTO | RPO |
|---|---|---|
| What it measures | Maximum acceptable downtime | Maximum acceptable data loss |
| Direction of measurement | Forward from failure | Backward from failure |
| What it protects | Service availability | Data recency |
| Primary technical driver | Recovery architecture | Backup/replication frequency |
| Typical units | Minutes to hours | Seconds to hours |
| Business impact of missing it | Revenue loss, SLA breach, operational halt | Data loss, reconciliation cost, compliance exposure |
The most common misconception: teams assume a tight RPO automatically means a tight RTO. It doesn’t. You can replicate data every 5 minutes (tight RPO) but still take 6 hours to rebuild and validate a failed application server (loose RTO). That recovery dependency belongs in the same operating plan as ongoing server and network support. The two parameters are independent.
There’s also a counterintuitive valid scenario: RTO can legitimately be greater than RPO. Append-only log stores or easily reconstructible datasets may need very fresh data (tight RPO) but can tolerate a longer rebuild window (loose RTO) because the data itself is the priority, not the speed of the service coming back up.
One practical gap that shows up repeatedly: many organizations set objectives on paper but never test them. Infrascale’s research on operational testing gaps found that a significant portion of organizations fail to perform regular backup or failover testing, meaning their documented targets don’t reflect real-world recovery performance. A plan that’s never been tested is a guess dressed up as a policy.
Pro Tip: Set your RTO shorter than your Maximum Tolerable Period of Disruption (MTPD) to allow contingency for real-world delays during incidents.
How to calculate and set RTO and RPO: a practical framework
NIST SP 800-34 is clear: recovery objectives should be set after a BIA, not before. The BIA is where you convert business risk into time thresholds. Skip it, and you’re guessing.
Step 1: Run or refresh the BIA
For each application or service, collect:
- Hourly financial loss from downtime (direct revenue, transaction fees, staff idle time)
- Regulatory deadlines that create hard cutoffs (HIPAA breach notification windows, SOX reporting cycles)
- Data re-creation cost if records are lost (labor hours, legal exposure, customer trust)
- SLA penalties triggered by extended outages
- Dependency map showing which systems must be online before this one can recover
Step 2: Convert losses to time thresholds
Here’s a simple walk-through. Suppose your e-commerce checkout processes $30,000 per hour. Your SLA carries a $10,000 penalty per hour of breach after the first 30 minutes. Your team estimates 4 hours of manual reconciliation for every hour of lost transaction data.
- Maximum financial tolerance before the loss becomes “unacceptable”: $50,000
- At $40,000/hour combined loss rate, you hit that threshold in roughly 75 minutes
- Apply a 20% safety buffer: target RTO of ~60 minutes
- Backup frequency needed to limit reconciliation to under 2 hours of work: RPO of 30 minutes or less
That’s not a formula you run once. Revisit it when revenue grows, when you add new systems, or after any major incident.
Step 3: Ask business owners the right questions
Riskonnect’s guidance makes the point plainly: business owners, not IT alone, must sign off on RTO and RPO because these are business risk decisions, not purely technical ones. The questions to put in front of them:
- How much revenue do you lose per hour this system is down?
- What’s the regulatory deadline that creates a hard cutoff?
- Can you operate manually, and for how long?
- What data, if lost, cannot be reconstructed?
- Which other systems depend on this one being available first?
Step 4: Validate through testing
A documented RTO is a hypothesis. A tested RTO is a fact. Schedule full restore tests and failover exercises at least annually for Tier 1 systems, and after any significant infrastructure change. Track actual MTTR against RTO targets and close the gap before the next review cycle. Rivell’s IT disaster recovery program guidance outlines how to structure these exercises in alignment with NIST standards.
Mapping RTO and RPO to application tiers
Tiering is the single most effective way to avoid budget bloat. Applying the same aggressive recovery target to every system in your environment is expensive and unnecessary. COO-level guidance is consistent on this: one-size-fits-all targets drive project failure and wasted spend.

| Tier | Label | Example Systems | Target RTO | Target RPO | Recovery Pattern |
|---|---|---|---|---|---|
| 0 | Always-on | Payment processing, real-time trading | Near-zero | Near-zero | Active-active, synchronous replication |
| 1 | Mission-critical | EHR, core ERP, authentication (AD/IdP) | < 1 hour | < 15 minutes | Hot standby, CDP, automated failover |
| 2 | Business-critical | CRM, email, VoIP, file shares | 2–8 hours | 1–4 hours | Warm standby, async replication |
| 3 | Important | Reporting, dev/test, internal portals | 8–24 hours | 4–24 hours | Cold standby, daily backups |
| 4 | Non-critical | Archives, static sites, legacy reference | 24–72 hours | 24 hours | Backup/restore only |
Before finalizing tiers, run a dependency check. Identity and directory services (Active Directory, Azure AD/Entra ID), DNS, and core databases are often prerequisites for Tier 1 and Tier 2 applications. If your ERP depends on Active Directory, Active Directory belongs in Tier 0 or Tier 1 regardless of how the business originally categorized it.
AWS Resilience Hub can automate this assessment for cloud workloads, assigning resiliency policies per application, evaluating components against those targets, and surfacing remediation recommendations with estimated cost impacts. For multi-account AWS environments, it’s a practical starting point for cloud-tier mapping.
Technical approaches to meet your RTO and RPO targets
The right technical pattern depends on the tier. Spending active-active money on a Tier 3 workload is a budget problem. Running daily backups on a Tier 1 system is a risk problem.
- Snapshots and incremental backups: Suitable for Tier 3–4. Low cost, simple to operate, but recovery times are measured in hours. RPO is limited by snapshot frequency.
- Continuous data protection (CDP): Captures every write in near-real-time. Supports very tight RPOs (seconds to minutes) without the overhead of synchronous replication. Good fit for Tier 1–2 when synchronous replication is cost-prohibitive.
- Asynchronous replication: Replicates data to a secondary site with a short lag (typically seconds to minutes). Balances cost and RPO for Tier 1–2 workloads. Introduces a small data loss window.
- Synchronous replication: Every write is confirmed at both sites before the transaction completes. Near-zero RPO, but latency constraints limit geographic distance between sites. Required for Tier 0.
- Hot standby (active-passive): A fully provisioned secondary environment ready to take over within minutes. Higher cost than warm standby; appropriate for Tier 0–1.
- Warm standby: A scaled-down secondary environment that can be brought to full capacity quickly. Balances cost and RTO for Tier 1–2.
- Cold standby / backup-restore: Infrastructure is provisioned only after a failure. Lowest cost, longest RTO. Appropriate for Tier 3–4.
- DRaaS (Disaster Recovery as a Service): Managed orchestration of failover to a cloud or co-location environment. Reduces the operational burden of maintaining standby infrastructure. Providers like Commvault and Rubrik offer DRaaS capabilities with policy-based orchestration and automated runbooks.
- Cross-region cloud failover: For cloud-native workloads, cross-region replication addresses geographic failure scenarios. Watch for dependencies: KMS key replication, IAM role availability, DNS cutover latency, and API rate limits at the secondary region all affect actual RTO.
Automation matters here. Runbook automation reduces human error during a high-stress recovery event and compresses actual MTTR. CISA’s federal incident response playbooks emphasize pre-authorized roles and documented playbooks for exactly this reason. Ransomware incidents add another layer: forensic validation before restoring to a clean point often extends both effective RTO and RPO beyond the paper targets. Immutable backups and air-gapped copies are the practical defense. For more on cyber-specific recovery, Rivell’s cyber attack recovery guide covers the SMB context in detail.
Cost and operational trade-offs when you tighten targets
The relationship between tighter objectives and cost is not linear. It’s a curve that steepens sharply as RTO and RPO approach zero.
Moving from a 4-hour RTO to a 1-hour RTO might require upgrading from cold standby to warm standby, adding monitoring, and improving runbook automation. Manageable. Moving from a 1-hour RTO to a 5-minute RTO likely requires active-passive hot standby with automated failover, dedicated bandwidth, and 24/7 on-call coverage. The cost jump is substantial.
The factors that drive cost upward:
- Synchronous replication requires low-latency links between sites and adds write latency to every transaction
- Additional geographic sites multiply infrastructure, licensing, and staffing costs
- Bandwidth for continuous replication across regions or to cloud providers
- Orchestration platforms (Commvault, Rubrik, and similar tools) add licensing cost but reduce manual recovery time
- Testing frequency for Tier 0–1 systems requires staff time and sometimes production-equivalent test environments
The decision rule is straightforward: compare the incremental cost of tightening a target against the estimated hourly business loss the BIA produced. If your checkout system loses $40,000 per hour and upgrading from a 4-hour RTO to a 1-hour RTO costs $8,000 per year in additional infrastructure, the math is easy. If the same upgrade costs $200,000 per year for a system that loses $500 per hour, the math is equally clear in the other direction.
Present options by tier to leadership, not as a single budget ask. Three costed scenarios per critical system (current state, recommended, and best-case) give executives a real choice rather than a number to approve or reject. Tie every budget line to a BIA outcome so the conversation stays grounded in business risk, not IT preference. For context on reducing IT downtime costs, the investment in tighter targets often pays back faster than it appears on a spreadsheet.
How Rivell assesses and implements RTO and RPO targets
When a managed IT provider takes on RTO/RPO work, the deliverables should be concrete and testable, not a spreadsheet of aspirational numbers. Here’s what a structured engagement looks like in practice.
Assessment and discovery checklist:
- Full application inventory with business owner, criticality rating, and revenue/operational dependency
- Data change rate analysis per system (drives RPO feasibility)
- Current backup configuration audit: frequency, retention, offsite/cloud copy, last tested restore date
- SLA and regulatory mapping (HIPAA, SOX, PCI-DSS, state-level requirements)
- Dependency mapping: identity, DNS, databases, third-party APIs
- Current MTTR baseline from incident logs
Typical sprint plan and deliverables:
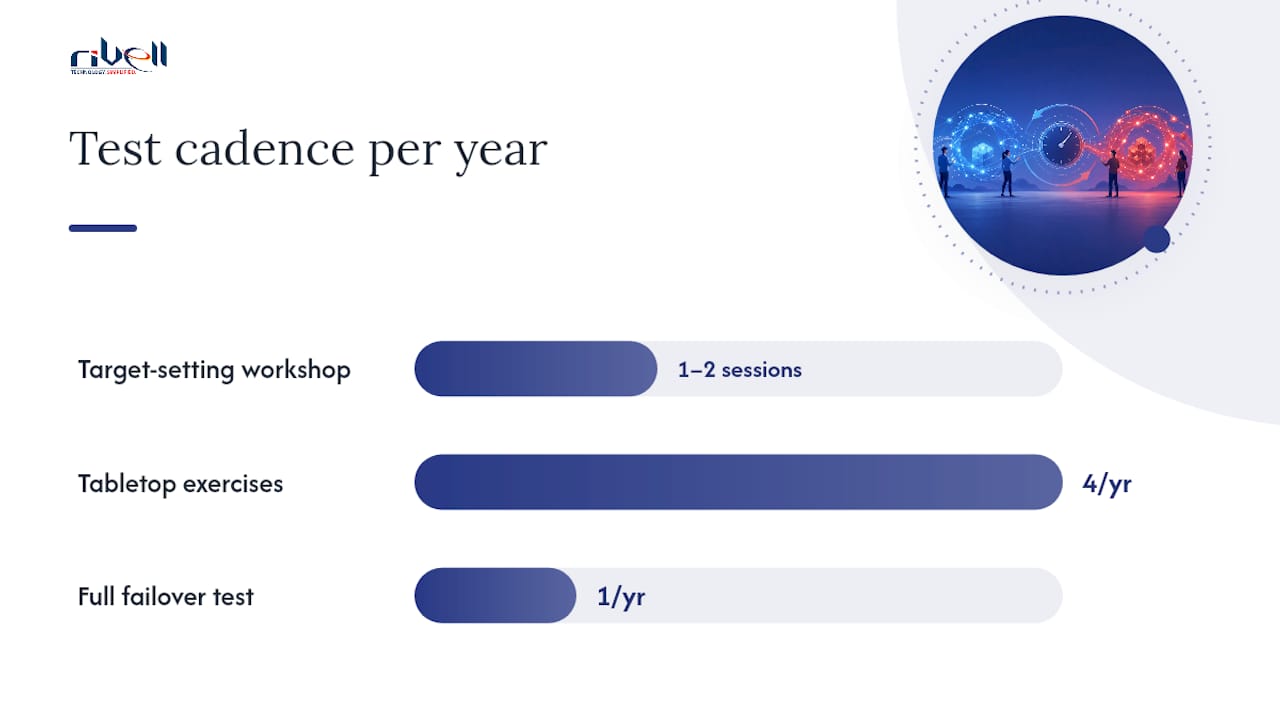
- Target-setting workshop with business owners and IT leads (1–2 sessions)
- Documented RTO/RPO per application tier with costed options
- Configured backup schedules, replication policies, and retention rules
- Runbook and incident playbook per Tier 0–1 system
- Scheduled test plan: tabletop exercises quarterly, full failover annually
Signs outsourcing makes sense:
- Backups exist but restores have never been tested
- No documented runbooks for critical systems
- IT staff lacks capacity to maintain and test DR alongside daily operations
- Compliance requirements (HIPAA, SOX) demand documented and audited recovery procedures
- A recent audit or incident revealed gaps between paper targets and actual recovery performance
One example pattern: a mid-size professional services firm with 80 employees had documented RTOs but no tested runbooks and backups that hadn’t been validated in over a year. After a structured BIA and tiering exercise, Tier 1 systems moved to a warm standby configuration with automated failover, and a quarterly test cadence was established. Within two quarters, MTTR for simulated Tier 1 failures dropped to within the documented RTO window. Rivell’s managed IT services include this full workflow, from assessment through ongoing test cadence.
What IT leaders get wrong when negotiating RTO and RPO with executives
The technical side of RTO and RPO is the easier half. The harder part is the internal conversation.
Finance wants to minimize spend. Operations wants systems back immediately. IT is caught translating between the two. The mistake most IT leaders make is presenting a single recommended target per system and defending it. Executives push back, IT compromises, and the final number reflects budget politics rather than actual risk tolerance.
Present three options instead: current state with its documented risk, a recommended middle tier, and a premium option with near-zero objectives. Attach a dollar figure to each, derived from the BIA. When a CFO sees that the “do nothing” option carries $40,000/hour in potential loss and the recommended option costs $15,000/year to implement, the conversation shifts from “why does this cost so much” to “why haven’t we done this already.”
Governance steps that prevent targets from becoming stale:
- Formal sign-off from business unit owners, not just IT leadership
- Annual review tied to the budget cycle or after any major infrastructure change
- Post-incident review that compares actual MTTR to documented RTO and updates targets if the gap is structural
- Test cadence written into the DR plan with named owners and scheduled dates
The NIST SP 800-34 framework and ISO 22301 both anchor BIA and recovery objective practices to documented governance cycles. For organizations subject to federal or healthcare regulation, referencing these standards in your sign-off documentation satisfies auditors and gives the internal conversation a neutral authority to lean on.
Rivell helps New Jersey businesses turn RTO and RPO targets into tested reality
Most businesses in New Jersey have backup software running somewhere. Far fewer have tested whether it actually meets their documented RTO and RPO. That gap is where incidents become disasters.
Rivell’s managed IT and disaster recovery services cover the full cycle: BIA-driven target-setting, configured replication and backup schedules, documented runbooks, and a scheduled test cadence that keeps your plan current. You get documented RTO and RPO targets per application tier, tested failover procedures, and an annual review built into the engagement. No guesswork about whether your recovery plan works. For businesses ready to move from paper targets to a tested, operational plan, contact Rivell to schedule an assessment.
Sources
Start with the primary standards when documenting governance or satisfying an auditor. These sources cover the full range from foundational definitions to cloud-specific implementation.
- RPO vs. RTO: Key differences explained with examples | TechTarget
- RTO vs RPO: What They Mean and How To Set Targets | Veeam
- NIST SP 800-34 Rev. 1: Contingency Planning Guide for Federal Information Systems
When in doubt, anchor your process to the NIST BIA methodology and validate targets through testing before presenting them to leadership or auditors.